Gains, losses in efforts to combat cyber crime in 2016: Trustwave
June 20, 2017 by Canadian Underwriter
Print this page Share
The fight against cyber crime showed both advances and retreats in 2016, with improvements on the intrusion detection and breach containment fronts matched by cyber crime increasingly being treated as a business, suggests a Trustwave report released Tuesday.
 Findings in the 2017 Trustwave Global Security Report reflect, among other things, real-world data from hundreds of company breach investigations in 2016 across 21 countries, and security and compliance events logged at its security operations centres.
“Cyber security in 2016 had both highlights and lowlights,” suggests Robert McCullen, chief executive officer and president of Chicago-based Trustwave, which provides solutions for businesses to fight cyber crime, protect data and reduce security risk.
“Our data breach investigations and threat intelligence show attackers continue to evolve their tactics and focus on extreme paydays as cyber crime becomes more like genuine businesses,” McCullen notes in a company statement.
Trustwave reports that threats like malvertisements became cheaper and malicious spam saw increases last year.
In 2016, company researchers tracked nine zero-day vulnerabilities, namely web-based, client-side vulnerabilities that vendors patched in 2016 that had exploit code in the wild prior.
Of the nine such cyber crime incidents, five targeted Adobe Flash Player, three targeted Microsoft Internet Explorer and one targeted Microsoft Silverlight, the report notes.
“Zero-day exploits are among the most prized commodities in the cyber criminal underground, as they offer the prospective attacker a greater chance of a successful compromise than an exploit for which a patch is already available,” it contends.
The cyber crime return realized by criminals from these zero-day vulnerabilities was high, likely indicating it is a “business” that will continue to grow.
Consider that the estimated cost for cyber criminals to infect 1,000 vulnerable computers with malvertisements was just US$5 – less than US$.01 per vulnerable machine and “far less than the US$80 to US$400 per 1,000 computers attackers pay for access to infected machines, depending on geo-location,” notes the report.
Compare that to US$95,000, the initial price advertised on an underground website for an undisclosed zero-day Windows vulnerability and accompanying exploit code.
“To see a zero-day offered for sale on a forum – and a publicly available forum rather than a dark-web forum accessed through the anonymous Tor network – is rare and suggests zero-days might be coming out of the shadows and becoming a commodity for criminal masses,” Trustwave cautions.
Add to these concerns recent malware developments. The lion’s share of malware samples examined by the company in 2016 – 83% – used obfuscation and 36% used encryption.
“In general, malware authors use obfuscation to attempt to hide the true nature of their code’s functionality from security tools,” the report explains. “They use encryption to hide the data they save to disk and/or send outside the victim’s network so monitoring controls will not flag the data or related communications,” it adds.
Related: Tech Threat
Malware-laden spam, for its part, is also on the rise, with the report showing that 35% of spam messages contained malware in 2016 compared to just 3% in 2015. In all, 60% of inbound email was spam, up from 54% in 2015.
“For most of this decade, spam volumes decreased every year as law enforcement disrupted several prolific spamming operations and other voluntarily ceased operations,” the report points out. “Unfortunately, this trend reversed itself in 2016 and volumes rose back to 2014 levels,” almost entirely attributable to the botnet Necurs, used when sending spam with malicious attached files.
Fortunately, though, “this does not mean organizations were victims of this level of malicious spam. Attackers target some domains more heavily than others.”
Still, malicious advertising “remains the number one source of traffic to exploit kit landing pages,” the review found.
Trustwave also cites the influence of increased database flaws. “Database vendors patched 170 vulnerabilities in the most common database products in 2016, up from 139 vulnerabilities in 2015,” the company points out.
Overall, 49% of data breaches investigated by Trustwave in 2016 were in North America, 21% in Asia-Pacific, 20% in Europe, Middle East and Africa, and 10% in Latin America and Caribbean. The retail industry, at 22%, accounted for the largest portion of the total, with food and beverage, other and finance/insurance rounding out the top four.
 Incidents affecting point-of-sale (POS) systems rose to 31% compared to 22% in 2015, while incidents affecting e-commerce environments fell to 26% from 38%.
With regard to the types of data targeted, 63% of all incidents investigated targeted payment card data.
Broken down, card track (also called magnetic stripe) data made up 33% of all incidents in 2016 (primarily from POS environments) and card-not-present (CNP) data accounted for 30% of incidents (mostly from e-commerce transactions).
“Merchants’ slow adoption of EMV (Europay, MasterCard, Visa) chip card readers in the United States again resulted in POS attacks accounting for the largest share of occurrences in North America,” states the report.
“The continued prevalence of POS compromises in North America is disappointing given the October 2015 industry-imposed deadline for businesses to install EMV-compatible equipment or assume liability for card fraud themselves,” it comments, citing Visa figures that just 38% of U.S. storefronts capable of using the technology are doing so.
“POS environments are likely to remain a tempting target for attackers while magnetic-stripe transactions remain pervasive in North America, and it may be another few years before POS-related incidents become as rare there as they are in the rest of the world,” the report notes.
Beyond payment card data, the remaining types of data targeted were as follows: financial credentials, 18%; destructive intent (non-specific), 7%; personally identifiable information, 4%; proprietary, 3%; and other, 5%.
More positively, report findings indicate, intrusion detection and breach containment times were relatively better in 2016 than in 2015.
“The longer a data compromise lasts, the more harm the attacker can do and the costlier the breach can be,” the report states. The median number of days from intrusion to detection of a compromise was 49 in 2016, down from 80.5 in 2015.
Perhaps more encouraging, though, was the finding again in 2016 that intrusion detection is particularly better when breaches are self-detected.
At 16 days (compared to 15 in 2015), internally detected incidents were a third of the median time overall and far less than the 65 days (down from 168 days in 2014) for externally detected incidents.
 Once internally detected, “the median number of days from detection to containment was 2.5 in 2016,” Trustwave reports.
“The same tools and techniques that enable businesses to detect breaches on their own or in partnership with a managed security services provider often make it possible to respond to them within days, or even minutes,” the report notes.
“By contrast, a business that requires an outside party to inform it of a breach often is unable to contain it quickly, and the compromise continues, sometimes for several crucial days,” it adds.
 Other report findings from 2016 investigations include the following:
- the median number of days from an intrusion to containment stayed relatively the same at 62 days in 2016 compared to 63 days in 2015;
- environments most breached were corporate and internal networks, at 43%; and
- almost half of the compromises were the result of insecure remote-access software and policies (30%) and phishing and social engineering (19%).
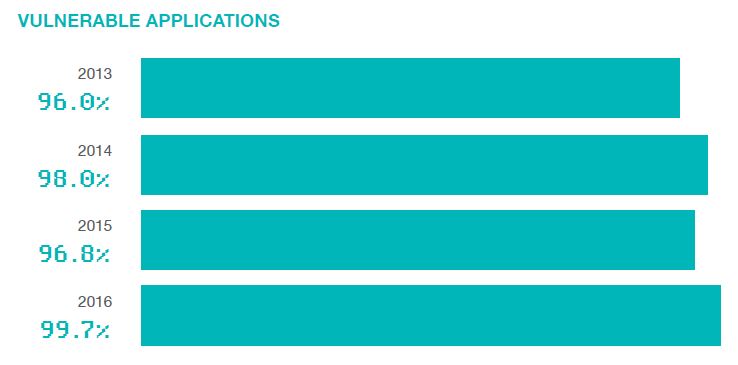
Related: Vast majority of tested applications have at least one vulnerability: cyber security report
Applications are almost always vulnerable. In all, “99.7% of web applications Trustwave application scanning services tested in 2016 included at least one vulnerability, with the mean number of vulnerabilities detected being 11 per application.”
Trustwave’s on-demand penetration testing service uncovered almost 30,000 vulnerabilities in web applications in 2016. Looking at application vulnerability risk levels, the company notes that 44% were low, 35% were informational, 11% were medium, 7% were high and 3% were critical.
 There are also issues with content management systems (CMSs). For opportunist cyber criminals, vulnerabilities in CMSs represent an express lane to their destination,” the report states. “A single reliably exploitable vulnerability in a popular CMS can enable an attacker to compromise hundreds or even thousands of web servers for purposes such as stealing user data or hosting exploit kit landing pages,” it explains.
Related: Holistic approach needed to reduce confusion around cyber security, tackle inaction: Echols
To combat cyber crime, “as an industry, we must continue to focus on key areas like threat detection and response, security scanning and testing and cloud security services that provide meaningful layers of protection from constantly evolving threats,” McCullen urges.
Recommendations for organizations handling sensitive data include the following:
- firewall configuration – among other things, restrict inbound and outbound access to and from the network;
- remote-access solution – among other things, ensure third-party remote access is an on-demand solution;
- malware removal – among other things, rebuild the system to fully confirm the removal of the threat if is it suspected that malware is (or was) on the system;
- patch management – among other things, patch the operating system within 30 days of vendor-released security patches/hotfixes; and
- policy and procedures – conduct employee security awareness training at least annually to educate employees on information security best practices.
Have your say: