Ocean temperatures can predict U.S. heat waves up to 50 days in advance: study
March 29, 2016 by Canadian Underwriter
Print this page Share
The formation of a distinct pattern of sea surface temperatures in the middle of the North Pacific Ocean can predict an increased chance of summertime heat waves in the eastern half of the United States up to 50 days in advance, according to a new study.
 Published in the journal Nature Geoscience on Monday, the study authors wrote that “an evolving pattern of sea surface temperature anomalies, termed the Pacific Extreme Pattern (PEP), provides for skillful prediction of hot weather within this region as much as 50 days in advance.”
The pattern is a contrast of warmer-than-average water butting up against cooler-than-average seas, the National Center for Atmospheric Research (NCAR) said in a press release, also on Monday. When this pattern appears, the odds that extreme heat will strike during a particular week – or even on a particular day – can more than triple, depending on how well-formed the pattern is.
“Summertime heat waves are among the deadliest weather events, and they can have big impacts on farming, energy use, and other critical aspects of society,” said Karen McKinnon, a postdoctoral researcher at NCAR and the lead author of the study, titled Long-lead predictions of eastern United States hot days from Pacific sea surface temperatures. “If we can give city planners and farmers a heads up that extreme heat is on the way, we might be able to avoid some of the worst consequences.”
The research was largely funded by the National Science Foundation, NCAR’s sponsor. In addition to McKinnon, the research team includes Andrew Rhines of the University of Washington, Martin Tingley of Pennsylvania State University and Peter Huybers of Harvard University.
For the study, the scientists divided the country into regions that tend to experience extreme heat at the same time. The scientists then focused on the largest of the resulting blocks: a swath that stretches across much of the Midwest and up the East Coast, encompassing both important agricultural areas and heavily populated cities. The research team looked to see if there was a relationship between global sea surface temperature anomalies – waters that are warmer or cooler than average – and extreme heat in the eastern half of the U.S.
Right away, a pattern popped out in the middle of the Pacific, above about 20 degrees North latitude, NCAR said in the release. The scientists found that the particular configuration of ocean water temperatures – the PEP – was not only found when it was already hot in the eastern U.S., but that it tended to form in advance of that heat. “Whatever mechanisms ultimately leads to the heat wave also leaves a fingerprint of sea surface temperature anomalies behind,” McKinnon said in the press release.
To test how well that fingerprint could predict future heat, the scientists used data collected from 1,613 weather stations across the eastern U.S. between 1982 and 2015, as well as daily sea surface temperatures for the same time period. The scientists defined extreme heat in the eastern U.S. as a summertime day when the temperature readings from the warmest 5% of weather stations in the region were at least 6.5 degrees Celsius (11.7 degrees Fahrenheit) hotter than average. The scientists only looked at extreme heat during that region’s 60 hottest days of the year: June 24 through Aug. 22.
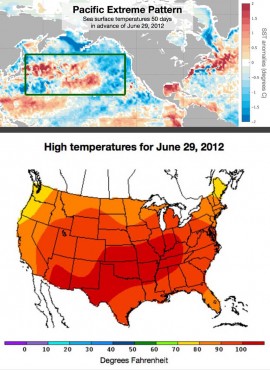
Top: Sea surface temperature anomalies in the mid-latitude Pacific 50 days in advance of June 29, 2012. The pattern inside the green box resembled the Pacific Extreme Pattern, indicating that there would be an increase in the odds of a heat wave in the eastern half of the United States at the end of June. (Image courtesy of Karen McKinnon, NCAR.)
Bottom: June 29, 2012, was the hottest day of the year in the eastern United States. The hot temperatures in late June and early July were part of an extraordinarily hot summer that saw three heat waves strike the country. (Map courtesy of the National Weather Service’s Weather Prediction Center.)
The researchers “hindcasted” each year in the dataset to see if they could retrospectively predict extreme heat events – or lack of those events – during that year’s summer, using only data collected during the other years as a guide. At 50 days out, the scientists were able to predict an increase in the odds – from about 1 in 6 to about 1 in 4 – that a heat wave would strike somewhere in the eastern U.S. during a given week, NCAR reported. At 30 days out or closer, the scientists were able to predict an increase in the odds – to better than 1 in 2 for a particularly well-formed pattern – that a heat wave would strike on a particular day.
This new technique could improve existing seasonal forecasts, which do not focus on predicting daily extremes. Seasonal forecasts typically predict whether an entire summer is expected to be warmer than normal, normal, or cooler than normal, the release said. For example, the seasonal forecast issued for the summer of 2012 predicted normal heat for the Northeast and Midwest. But, the summer ended up being especially hot, thanks to three major heat waves that struck in late June, mid-July, and late July.
When the science team used the PEP to hindcast 2012, they were able to determine as early as mid-May that there were increased odds of extremely hot days occurring in late June. The hottest day of the summer of 2012, as measured by the technique used for this study, was June 29, when the warmest 5% of weather stations recorded temperatures that were 10.4 degrees Celsius (18.7 degrees Fahrenheit) above average.
“We found that we could go back as far as seven weeks and still predict an increase in the odds of future heat waves,” McKinnon said. “What’s exciting about this is the potential for long-range predictions of individual heat waves that gives society far more notice than current forecasts.”
Scientists do not yet know why the fingerprint on sea surface temperatures in the Pacific predicts heat in the eastern U.S. It could be that the sea surface temperatures themselves kick off weather patterns that cause the heat. Or it could be that they are both different results of the same phenomenon, but one does not cause the other, NCAR said.
To learn more about how the two are connected, McKinnon is working with colleagues at NCAR to use sophisticated computer models to try and tease apart what is really happening.
The study’s findings also point toward the possibility that the PEP, or a different oceanic fingerprint, could be used to forecast other weather events far in advance, including cooler-than-average days and extreme rainfall events.
“The results suggest that the state of the mid-latitude ocean may be a previously overlooked source of predictability for summer weather,” McKinnon said.
Have your say: